
Sensor Intelligence for smart buildings
Know what your buildings are quietly wasting.
Building analytics and predictive maintenance software, grounded in your own data.
FrostLogic Explore reads the BMS, meters and sensors you already have — and hands your team a short, ranked list of what's costing money and exactly what to do about it.

What Explore does
From raw telemetry to ranked actions.
One platform. Every job. All grounded in the data you already have.
Click to explore each
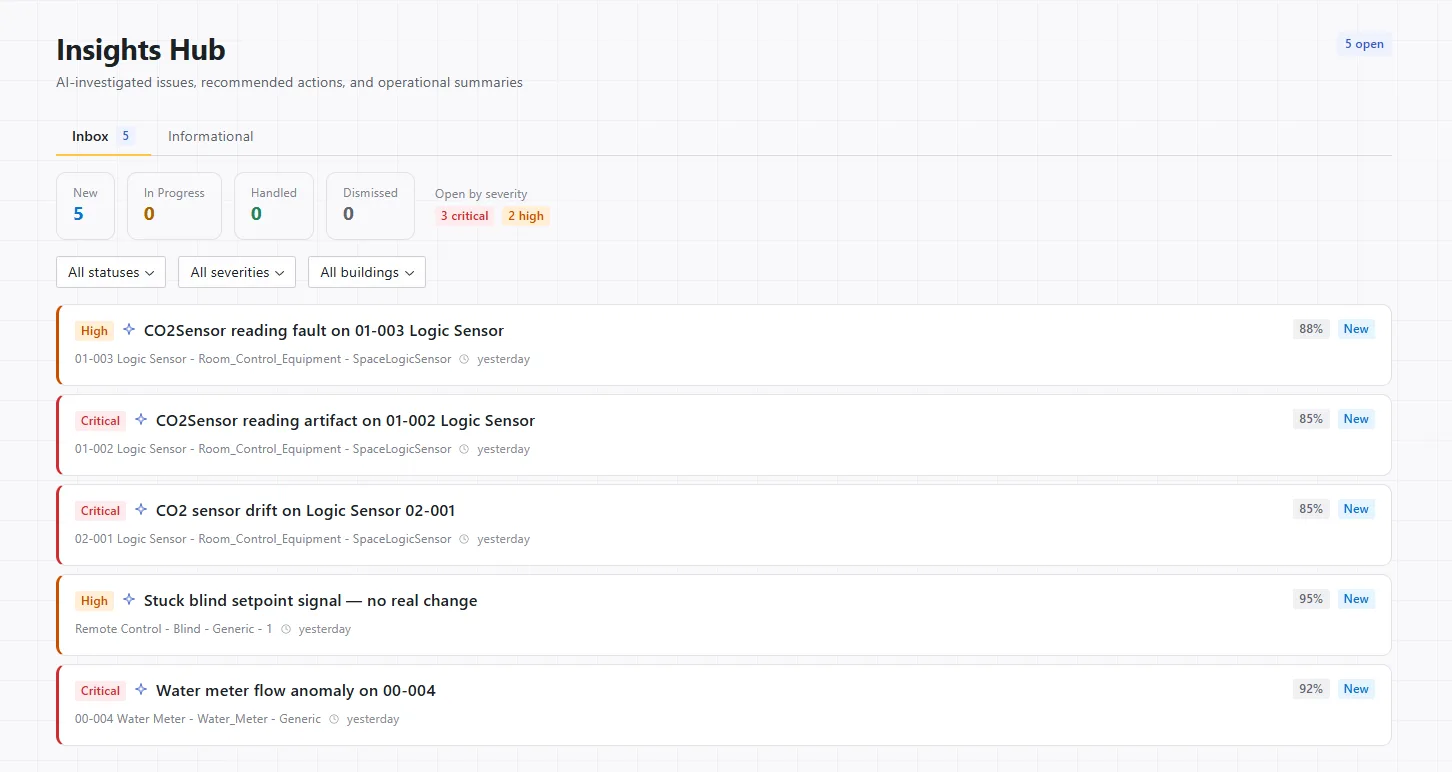
See what your sensors are hiding.
Six methods rank every anomaly into one inbox — twenty items, not two thousand alarms. Each carries a confidence score and a suggested next action.
See it live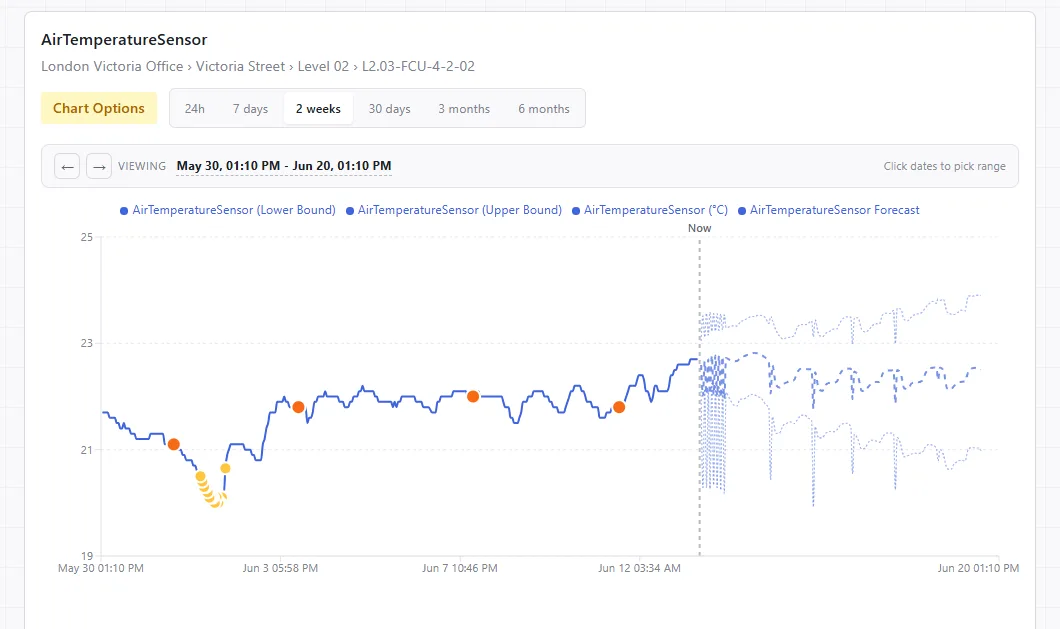
Plan with confidence.
Multi-horizon forecasts with honest confidence bands, drawn straight onto the live trend — so your team knows whether to act on a number or watch it.
See it live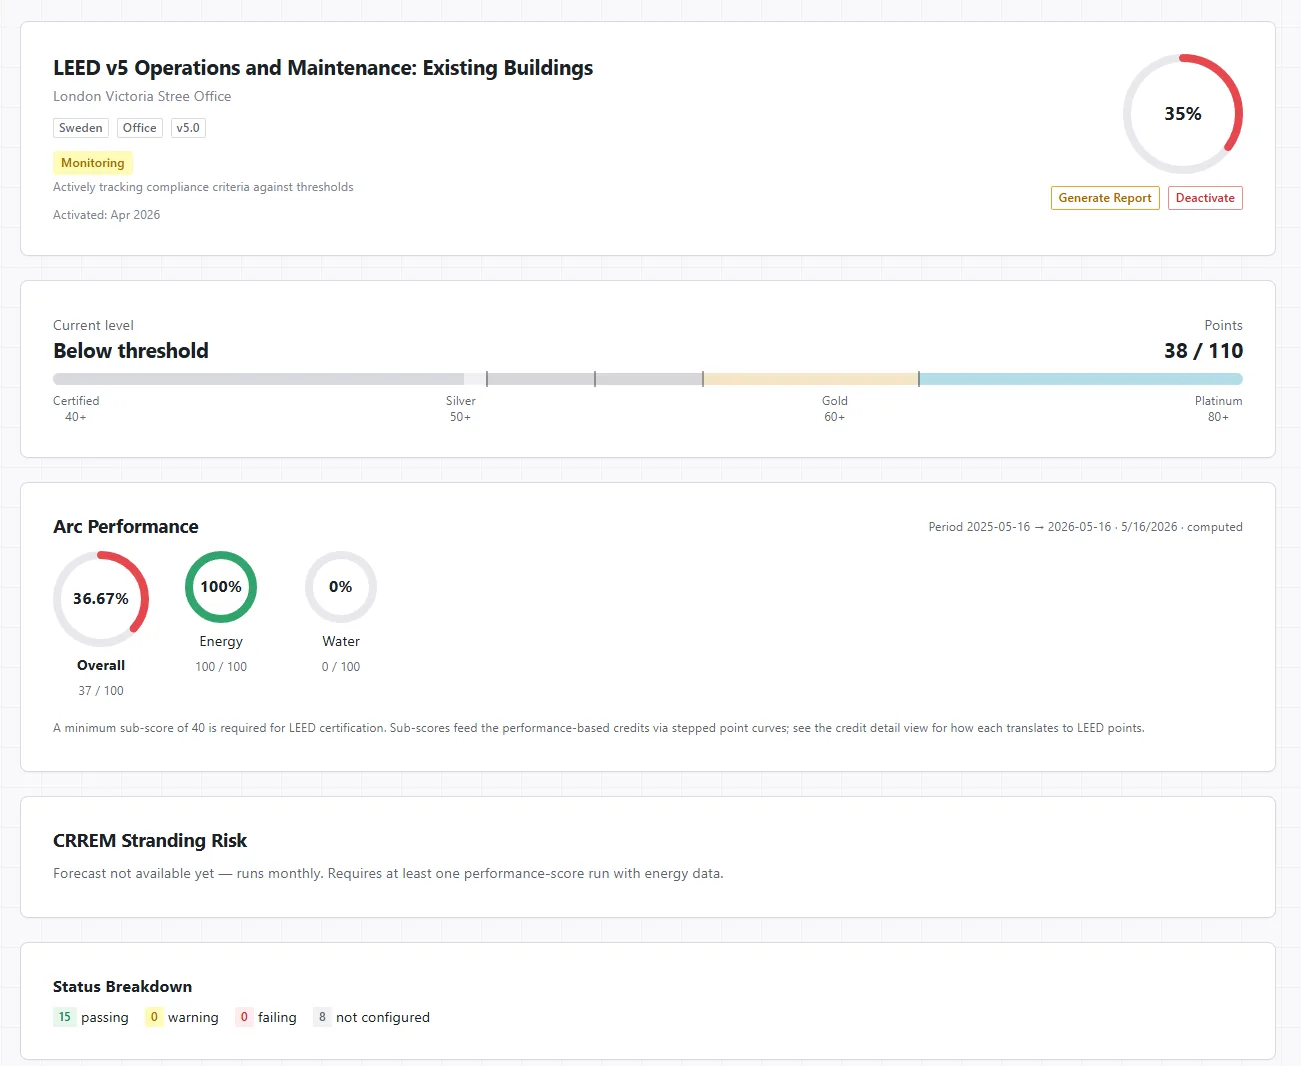
Prove compliance, continuously.
Live evidence for BREEAM, LEED and Nordic Swan, scored against thresholds as it happens. When the assessor asks, the report is one click away.
See it live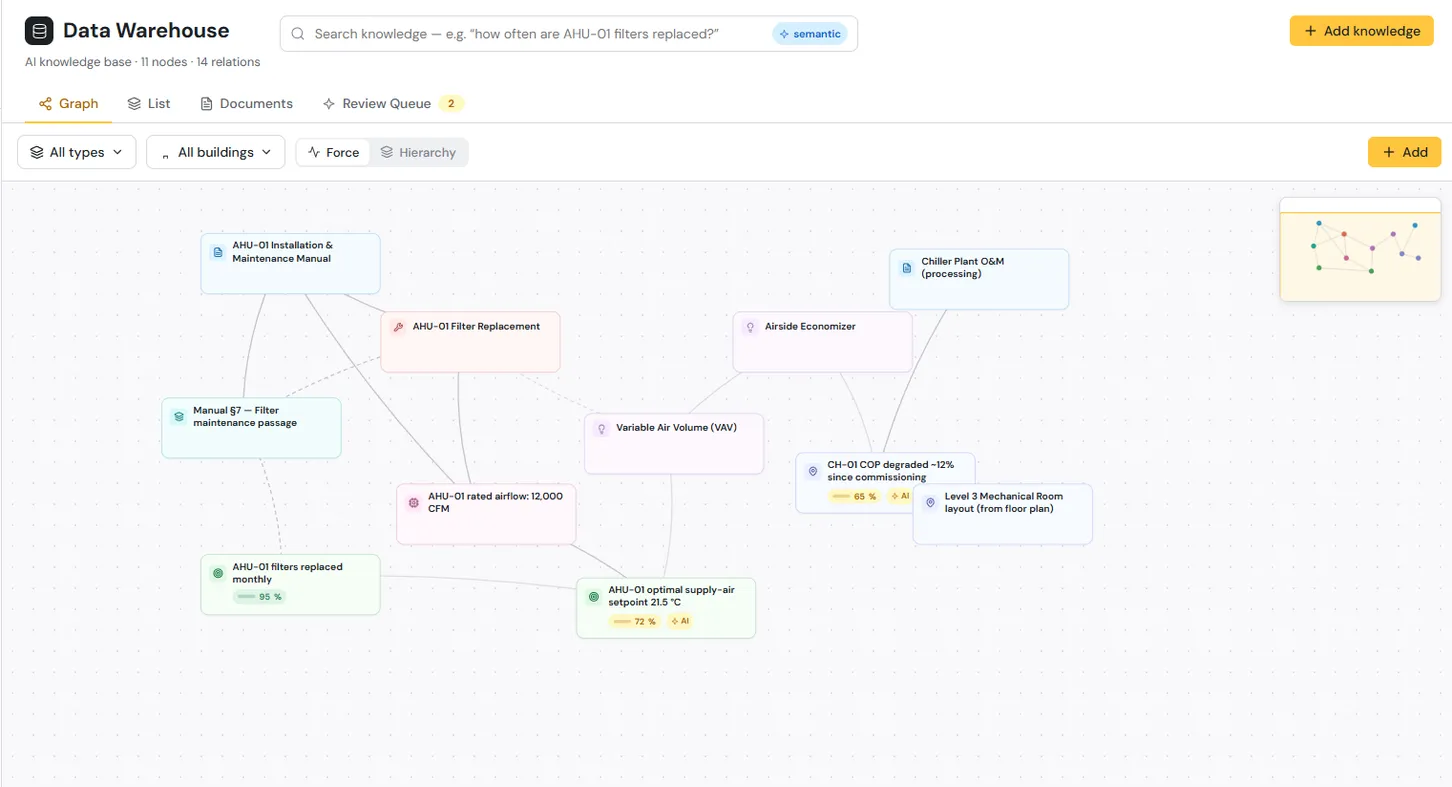
Your building's manuals, one search away.
Upload every manual, procedure, and compliance doc, and Explore turns them into a searchable knowledge graph. Ask a question and the AI answers from your own documents, hosted in the EU on our hardware, not a generic model guessing.
Explore Data WarehouseIn the operator's chair
What a Monday morning looks like.
One screen, already triaged — the first item is the one that most deserves your attention at 07:42.
- A
Ranked by consequence, not time.
The most consequential item is first — not the most recent.
- B
A suggested action, not a chart.
Research, Go to metric, Acknowledge or Resolve — proposed, you confirm.
- C
A cost of waiting.
Every item carries kWh/day, comfort-hours and certification budget at risk.
- D
A full audit trail.
Every action timestamped and replayable. No six-week reconstruction.
Grounded AI
AI that doesn't know your building is just a confident guess.
Most building AI hallucinates because it has never understood the building. Our reasoning engine is grounded by FrostDynamics — a World Model that gives every AI agent a physical understanding of how your building actually operates. Answers come from thermodynamics and your data, never guesswork.
Both AHU fans ran continuously at 25 Hz overnight at low occupancy — the dominant driver of the flat overnight load.
- Cross-checked against the heat-mass-energy balance — physically consistent.
- 3 sensors cited, 0 values invented.
- Matches the site's learned overnight baseline.
A physical understanding of how your building behaves.
Thermodynamic constraints
Trusts physics over a probe when they disagree.
Sensor cross-validation
Catches drift, stuck and offline before they mislead.
Site-learned baselines
Knows the building you have now, not a generic one.
Industries
Explore Sensor Intelligence by industry.
Run comfortable, efficient buildings.
Spot HVAC drift, comfort breaches and silent energy waste across the whole portfolio — ranked, each with the fix attached.
Learn more — Smart Buildings Smart Buildings & Facilities
Catch grid anomalies before they cascade.
Demand forecasting and anomaly detection across metering and grid telemetry — with honest confidence bands on every number.
Learn more — EnergyEnergy & UtilitiesKeep the line running.
Predictive maintenance from process telemetry — one root-cause ticket, not a storm of downstream alarms.
Learn more — Manufacturing Manufacturing & Heavy Industry
Protect critical environments.
Continuous monitoring for critical equipment and clean-room conditions, with audit-ready evidence collected as it happens.
Learn more — Healthcare Healthcare & Life Sciences
One decision layer across every site.
Bring scattered building portfolios under a single ranked queue — one view, every property, no extra hardware.
Learn more — Public Sector Public Sector & Infrastructure
See every link in the cold chain.
Environmental and fleet telemetry watched continuously, so excursions surface before the load is lost.
Learn more — Logistics Logistics & Supply Chain
Deployment · Security · Residency
Two ways to run it. Your call on residency.
Enterprise — customer-hosted
Runs in your Kubernetes cluster or private cloud. Your infra, your SLAs, your governance. You own data and trained models.
Managed SaaS
Hosted by us on Hetzner's EU-based, ISO 27001 certified data centres. GDPR-native. Fast onboarding, no infra setup on your side.
Grounded by design
No PII — building and operational sensor data only. Grounded inference, deterministic guardrails. No vendor lock-in.
Resources
Field-tested perspectives.
Before you ask
The questions we get on the first call.
Software that reads the BMS, meters and sensors you already run, and returns a short ranked queue of what to act on, each item with a reason and a cost of waiting. No new hardware. Read-only.
Your BMS runs the building. A dashboard shows you charts and leaves the thinking to you. Explore sits on top and tells you which twenty things deserve attention this morning. The dashboard is the question; the queue is the answer.
No. Explore reads from your existing BMS, meters and IoT sensors over BACnet, Modbus, OPC UA, oBIX, MQTT and M-Bus. It never writes back. If the BMS has no cloud connection at all, a small agent on its PC covers that.
In the EU. Managed SaaS runs on Hetzner's ISO 27001 data centres, GDPR-native, or you self-host in your own Kubernetes cluster. The platform processes building and sensor data only, no PII.
Every answer is grounded in your data and the building's physics through our FrostDynamics engine. It cites the sensors it used and invents nothing. When signals disagree, it trusts the physics over a drifting probe.
Tell us what you're trying to figure out. We connect to a sample of your data and show you what Explore surfaces, live. 30 or 60 minutes, your pick.
Yes. The FrostLogic Edge Agent on that PC reads the BMS over BACnet, OPC UA, Modbus or oBIX and pushes the data read-only to Explore. No hardware, no BMS cloud licence. Estates where the licence lapsed years ago connect the same way.
What's your building not telling you?
Tell us what you're trying to figure out: energy drift, a BMS you don't trust, compliance you're chasing. We listen first, then tell you straight whether Explore helps. 30 or 60 minutes, your pick. No commitment either way.