BMS analytics
Building management system software, turned into decisions.
Connect Siemens, Schneider, Honeywell, Trend, Bastec — or anything BACnet, Modbus, or OPC UA. Explore reads from your existing BMS and returns a prioritised action queue.
The problem
Why most building management system software stops at the dashboard.
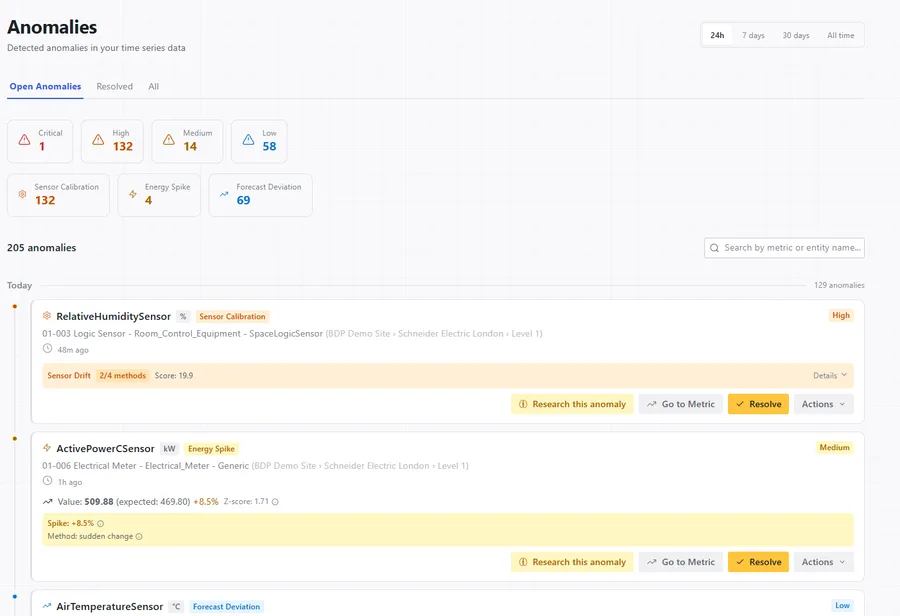
Data without decisions.
More charts, more colours, more tabs. None of which tells the operator what to do this morning.
Dashboards without actions.
A view is a question. An action is an answer. Most platforms ship the question and call it a product.
Alarms without context.
A buzzer that fires on every threshold breach is ignored within a week. Explore ranks every alert by severity and likely cause.
How it works
From BMS read-only feed to ranked queue.
01
Your BMS
Siemens · Schneider · Honeywell · Trend · Bastec
02
Read-only ingest
BACnet · Modbus · OPC UA
03
Frostdynamics engine
Anomaly · Forecast · Causal
04
Prioritised queue
What to act on. In what order.
Supported integrations
If your BMS speaks any of these, we read from it.
BMS vendors
Protocols
Missing one? Tell us what you run.
Focused on energy specifically? See our energy management software.
Worked example
A single floor's HVAC drift, captured live.
- 1
Sensor drift detected.
A return-air temperature sensor on floor 4 starts drifting +0.4°C/day relative to the supply-air physics model. Statistical-only platforms miss it; physics-aware methods catch it on day three.
- 2
Causal filter applied.
Causal filtering connects the drift to elevated chiller cycling downstream — and suppresses the dozen related “alerts” the BMS would have fired.
- 3
Ranked, assigned, resolved.
Single ticket lands in the operator queue with severity “High” and suggested action “recalibrate or replace”. Mean time to detect drops from weeks to days. Audit trail is captured automatically.
Beyond HVAC
One queue for HVAC, IoT and every building monitoring system.
An IoT building management system, read as one.
Modern buildings bolt IoT sensors onto the BMS — air quality, occupancy, sub-metering, leak and energy sensors over MQTT and M-Bus. Explore reads the BMS and the IoT layer together, read-only, and ranks them in a single queue instead of a second dashboard.
HVAC, where most of the waste and the faults live.
An HVAC building management system generates the bulk of a building's telemetry and most of its avoidable cost. Explore grounds every HVAC signal in the plant's physics — catching a drifting sensor or a fighting setpoint before it becomes a comfort complaint or an energy spike.
From building monitoring to building decisions.
Most building monitoring systems stop at charts and threshold alarms. Explore cross-checks each signal, suppresses the alarm storm, and hands the operator a ranked list of what to act on — monitoring that ends in a decision, not a wall of metrics.
Before you ask
What teams ask about running this on their BMS.
Software that connects to a building's BMS and turns its raw points into something an operator can act on. Explore goes past monitoring: it ranks every issue by severity and likely cause, then proposes the fix.
No. It reads from your existing BMS, read-only, and adds an analytics and decision layer on top. It works with Siemens, Schneider, Honeywell, Trend and Bastec, or anything speaking BACnet, Modbus or OPC UA.
BACnet, Modbus, OPC UA, MQTT and M-Bus, across Siemens, Schneider, Honeywell, Trend and Bastec. If you run something else, tell us what it is.
Most built-in analytics stop at charts and threshold alarms. Explore cross-checks each signal against the building's physics, suppresses the alarm storms, and hands the operator one ranked queue instead of a wall of metrics.
The demo runs against a sample of your data in 20 minutes. In production most teams see ranked findings in the first week, with no new hardware.
Yes. It reads the BMS and the IoT sensors layered on top — air quality, occupancy, sub-metering, leak and energy sensors over BACnet, Modbus, OPC UA, MQTT and M-Bus — and ranks them in one queue. It's read-only and adds nothing to the field.
Yes. HVAC is where most building telemetry and most avoidable cost sit. Explore grounds every HVAC signal in the plant's physics, so it catches drift and fighting setpoints the BMS's own thresholds miss.
A building monitoring system shows you charts and fires alarms. Explore goes one step further: it cross-checks each signal, suppresses the alarm storm, and returns a ranked list of what to fix first. Monitoring tells you what happened; Explore tells you what to do.
Bring your BMS feed. We'll show you what it's hiding.
20-minute demo against a sample of your data. Senior engineer on the call.