A typical commercial building with a BMS generates somewhere between 5,000 and 50,000 data points per hour. Temperature readings logged every few seconds. Energy consumption tracked at granular intervals. CO2 levels, humidity, occupancy signals, equipment runtimes — all flowing into a database that, in most buildings, almost nobody reads.
Not because nobody cares. Because collecting data and making sense of it are two different problems, and the industry has spent decades solving the first one while mostly leaving the second alone.
What “building insights” actually means
A dashboard that shows your current energy consumption is useful. A dashboard that shows a trend line is more useful. Neither of those is an insight.
An insight is something that changes what you do next.
Raw sensor readings are just numbers. When you aggregate and contextualize them, you get information (your building used 12% more energy this week than last). When you connect that information to a cause, you get an insight (the increase happened because HVAC unit 4 was running during unoccupied hours). When you act on the insight, you have a decision that actually improves the building.
Most BMS setups live at the information level, on a good day. The jump from information to insight requires either sustained manual analysis or tools built specifically to bridge that gap — and most BMS platforms were not designed with that job in mind.
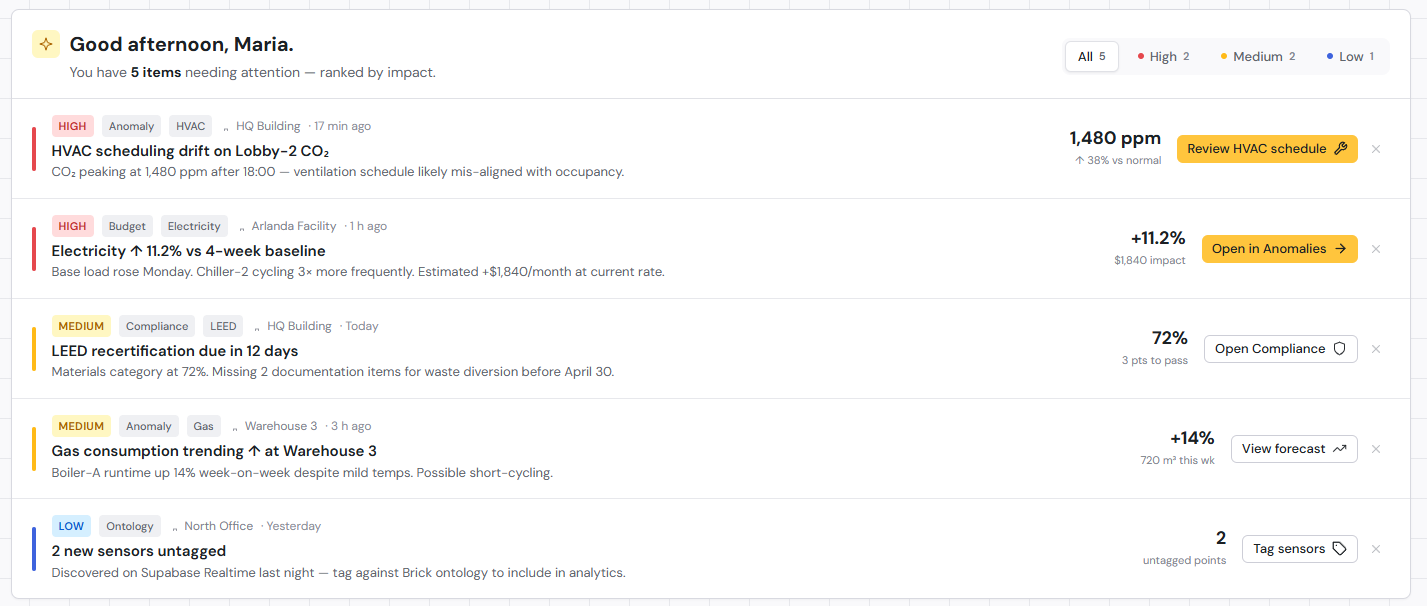
This is where reactive monitoring and proactive intelligence part ways. Reactive monitoring tells you something went wrong. Proactive intelligence tells you something is trending somewhere you do not want it to go, before it becomes an incident, a failed inspection, or a very bad summer week.
Five building insights hiding in your sensor data right now
If your building has temperature, energy, occupancy, air quality, and equipment sensors, you almost certainly have enough data to surface all of these. The question is whether anyone is looking.
Your HVAC systems may be fighting each other
Simultaneous heating and cooling in adjacent zones is one of the most common and most expensive problems in commercial buildings, and one of the least discussed. It happens when a heating zone and a cooling zone work against each other, often because setpoints were configured without accounting for how those zones interact physically.
What makes this difficult to catch: each system looks fine when you check it in isolation. The conflict only becomes visible when you look at multiple zones at once, over time. Without that view, the energy waste just bleeds into the monthly bill as noise.
Energy consumption is drifting from baseline
Buildings have consumption patterns. When something changes — a valve not closing fully, new overnight equipment running, a system entering a less efficient operating mode — energy use tends to creep up. Gradually enough that no single day looks alarming.
By the time someone notices the utility bill, the drift may have been running for weeks. Tracing it back to a root cause without systematic baseline comparison is hard. More often than not, it does not get traced at all.
Occupancy patterns do not match your scheduling assumptions
Most HVAC and lighting schedules reflect how buildings were expected to be used when they were commissioned. That expectation rarely survives contact with how buildings are actually used, and hybrid work patterns have widened the gap considerably.
If your occupancy sensors consistently show divergence from your schedule, you are conditioning space that does not need it and under-conditioning space that does. Once you know about it, the fix is usually straightforward. Without looking at occupancy data alongside energy data, there is no obvious reason to investigate in the first place.
Air quality fluctuations are affecting your tenants
CO2 levels, particulate counts, and humidity all affect how people feel and how well they concentrate, even when they cannot name what is wrong. Tenants notice in the way people notice when something is off about a restaurant: they cannot always say what it is, but the experience is not what it should be.
For buildings pursuing WELL certification or equivalent standards, this data is directly relevant to compliance. But even without certification goals, persistent air quality problems affect tenant satisfaction and, eventually, renewal decisions. The data to catch these fluctuations is almost always already being collected.
Equipment is approaching failure
Most building equipment does not fail suddenly. It fails progressively. Vibration patterns shift. Operating temperatures drift upward. Runtime to reach a target setpoint increases as efficiency drops.
No single signal is definitive on its own. But patterns across signals, tracked over time, are a reliable predictor of impending failure. A chiller working harder than usual to hit the same setpoint, while also showing elevated operating temperatures, probably needs attention before it quits during a heat wave. Your BMS has that data. It just is not connecting those dots automatically.
Why most buildings do not get insights from their data
The tooling gap is the most visible part. Most building management system software was designed to control equipment and log data, not analyze it. Pulling patterns out of a BMS often means writing custom database queries or exporting to spreadsheets, and that is not something most facility teams have time for.
Behind that sits a skills gap. Data analysis is a different discipline from building operations. Facility managers are experts in their buildings. Asking them to also do systematic data work on top of an already full workload is a significant extra burden, and finding someone who understands both building systems and data analysis is harder than it sounds.
And underneath both of those is a priority problem. In most operations environments, reactive work crowds out proactive work. When something breaks, you fix it. When nothing is visibly broken, there is always something more urgent than mining sensor data for early warning signals.
The three of these together tend to lock buildings out of their own data. Without the right tools, getting insights takes long enough that it stops happening consistently. When it stops happening consistently, there is no track record to justify investing in better tools.
How AI changes the equation
The reason AI is worth taking seriously for building data analytics — not just as a category buzzword — is that pattern detection across time-series sensor streams is exactly what machine learning handles well.
Anomaly detection that would take a human analyst hours to configure and run can run continuously across all your sensor data at once. The system is not just looking for what you thought to check. It is looking for deviations from whatever the normal pattern turns out to be, which means it catches things you would not have thought to investigate.
Forecasting works on the same principle. Predicting when equipment is likely to need maintenance, based on performance degradation patterns, is a probabilistic problem that improves with more historical data. A BMS alert fires when a value crosses a fixed limit. A predictive model flags when the trajectory of multiple values suggests something is wrong, even if none of them has crossed a threshold yet. That is a different kind of signal, and it is earlier.
Automated compliance tracking follows the same logic. The volume of data involved in energy benchmarks, air quality certifications, and reporting requirements makes manual review impractical. A system that checks continuously is doing something humans technically could do but, in practice, will not.
FrostLogic’s sensor intelligence tools are built on this approach. The goal is not more dashboards. It is surfacing what your data is already trying to tell you, automatically, so your team can act on it rather than search for it.
If you want to understand how AI-based analysis handles data trust and sensor validation specifically, the article on AI and sensor data reliability covers the methodology in more depth.
Getting started: from raw data to actionable insights
You do not need to overhaul your entire setup to start getting more from your building data.
Start by auditing what sensors you actually have. Map your coverage: which systems are reporting, how frequently, and with what reliability. You may have better data than you think, or gaps you did not know about. Either answer is useful before you start evaluating platforms.
Then get specific about what you want to know. Not “improve efficiency broadly” but concrete questions: why is energy higher in zone B than zone A? Are we conditioning space that is consistently unoccupied? What is driving the uptick in maintenance calls on the east wing? Specific questions make it much easier to tell whether a given tool is actually useful, or just another dashboard dressed up differently.
When you evaluate platforms, the key question is not “does this visualize my data?” It is “does this tell me something I would not have thought to look for?” If the answer to the second question is no, you are still doing all the analytical work yourself.
A good place to start is the Building Intelligence Score — a free assessment that benchmarks your building’s data maturity and shows where the gaps are. It takes about ten minutes and tends to surface at least one thing people had not expected.
If you want to see what this looks like against your specific building’s data, you can request a demo of FrostLogic Explore.
FrostLogic Explore brings sensor intelligence, scenario simulation, and grounded-inference AI to commercial and industrial buildings. Learn more about Sensor Intelligence or request a demo.
Curious how this would look on your building?
Book a 20-minute walkthrough.
Sensor Intelligence on a sample of your data. Senior engineer on the call.