Energy waste detection: finding the waste your BMS won’t flag
Energy waste detection is the continuous analysis of a building’s sensor and meter data to find energy the building consumes without needing to. It differs from an energy audit in one important way: it never stops. An audit photographs the building once. Detection watches it every day.
The uncomfortable part is that most waste never trips an alarm. The US EPA’s Energy Star programme has put the figure at as much as 30 percent of the energy used in commercial buildings, and most of that sits in buildings that look normal on every screen. The building runs. The rooms are warm. Nobody complains. The waste is invisible precisely because nothing is broken.
A BMS runs the building. It doesn’t judge it.
A building management system executes instructions: schedules, setpoints, interlocks, alarms. It is very good at this, and that is exactly why it misses waste.
BMS alarms are thresholds. A value crosses a line someone configured at commissioning, and the alarm fires. Waste rarely crosses those lines. It sits comfortably inside them. When a heating valve and a cooling coil fight each other over the same air, both control loops are doing precisely what they were told. Every point reads normal. The building burns money in a state of perfect technical health.
There is also a volume problem. A mid-size commercial building produces thousands of data points every few minutes. An operator can realistically watch a few dozen. BMS data analysis became a discipline of its own because the control layer has no opinion about efficiency, and no human has the hours to form one manually.
Where the waste hides
The usual suspects, roughly in the order we find them:
- Simultaneous heating and cooling. The classic. Two loops working against each other, often for years, with every individual reading inside its limits.
- Schedule creep. The extended-hours override someone set last winter and nobody reverted. Ventilation serving an empty floor all weekend. Buildings accumulate these the way houses accumulate drawers of cables.
- Economizer and free-cooling faults. A damper stuck closed means the chiller does work the outside air would have done for nothing. In a Nordic climate this one is expensive.
- Sensor drift. A supply-air sensor reading two degrees low makes the entire loop compensate, permanently. The BMS trusts its sensors. It has no way not to.
- Short cycling. A pump or compressor starting far more often than its duty requires wears itself out and wastes energy doing it. It also predicts a failure, which is a separate bill.
None of this shows up on the utility bill until later, and even then the bill only says the total got worse. It doesn’t say why, or where, or what each fault costs per week to ignore.
How energy waste detection works
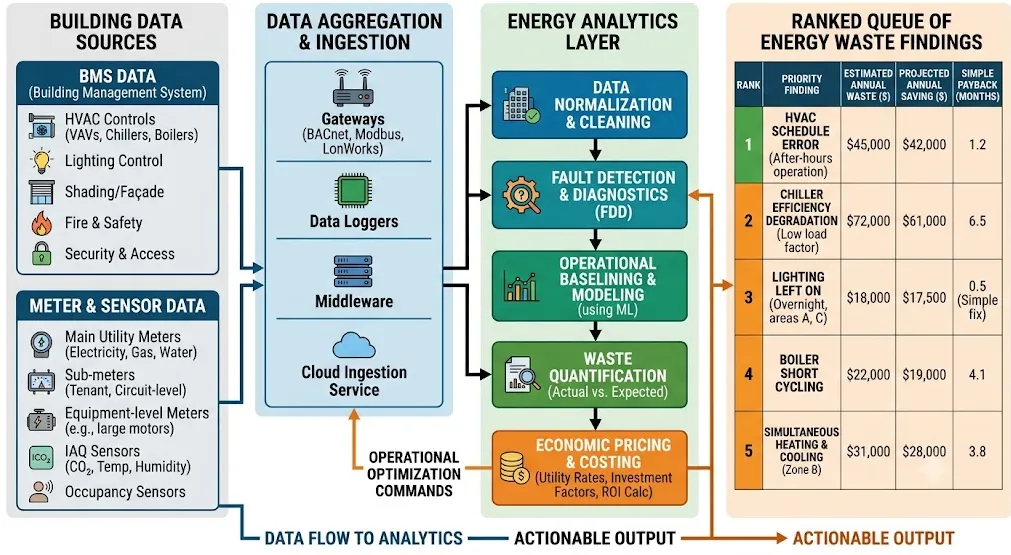
The method is the same whoever the vendor is. Read the data the building already produces. Model what each point should look like given weather, occupancy and time. Flag what deviates. Explain why.
Reading the data means BMS points over open protocols such as BACnet, Modbus and OPC UA, plus energy meters and whatever IoT sensors are already installed. No new hardware. For buildings whose BMS has no cloud licence, a software agent on the BMS PC does the job. The vendor-specific details are on our integrations pages.
Modelling is where tools diverge. Threshold rules find the faults someone predicted in advance. Statistical baselines catch drift and schedule anomalies that rules never anticipated. FrostLogic Explore runs six anomaly detection methods with causal filtering on top, so one root cause surfaces as one finding instead of fifty correlated alarms. The full capability set is on our BMS analytics platform page.
Then there is evidence, which is the part we are strict about. Every finding should trace back to the sensor readings behind it. If a tool says an air handler wastes 400 kWh a week, you should be able to open the finding and see the data that says so. Energy efficiency monitoring shows you numbers. Detection names the fault and shows its work. If a platform can’t do that second part, you’ll spend your savings verifying its claims.
Detection without prioritisation is just a longer alarm list
Finding waste turns out not to be the hard part. Once the models run, findings pile up quickly. The operator’s question was never “what’s wrong with this building”. It’s “what do I act on this week”.
So the output format matters as much as the detection method. A dashboard of anomalies is homework. A ranked queue with cost attached is a work plan. Explore prices each finding, weighs it against everything else it has found, and puts it in one queue sorted by what’s worth doing first. HVAC energy savings stop being an estimate on a slide and become line items: this valve, this building, this much per week. Operating cost reduction, in practice, is a stack of small fixes done in the right order.
At portfolio scale this stops being a preference and becomes the whole problem. Forty buildings produce forty buildings’ worth of findings, and a stuck damper in building 4 has to compete for attention with an energy drift in building 17. Ranking findings across an estate is a different job from analysing one building, and we wrote up how we handle it on our page about BMS analytics for large portfolios.
An audit finds waste once. Detection keeps finding it.
Energy audits are useful, and if you’re a large EU company you’re required to run one at least every four years anyway. The problem is decay. An audit is right about the building it inspected on the day it inspected it. Then seasons change, tenants move, overrides accumulate, and sensors drift. By year three the report describes a building that no longer exists.
The two work well together rather than competing. Continuous detection makes the next audit faster and cheaper, because the data work the auditor would bill for is already done. It also answers the question audit reports can’t: did the fix hold? Instead of trusting the estimate in the report, you watch consumption before and after the repair with weather and occupancy modelled out. Explore additionally forecasts each metric from one hour to seven days ahead with confidence bounds, so you see next week’s consumption drifting off course before it happens rather than after.
Traditional energy audit tools and continuous detection meet in the middle here: the audit sets the strategy, detection runs the everyday energy efficiency optimization between audits (the same job UK practice calls energy monitoring and targeting) and proves which interventions actually worked.
FAQ
What is energy waste detection? Continuous analysis of a building’s BMS, meter and sensor data to find energy being consumed without need: fighting control loops, schedule errors, stuck dampers, drifted sensors. Unlike an audit, it runs all the time, and good implementations attach a cost and evidence to every finding.
Do we need new hardware or a BMS upgrade? No. Detection reads the data your systems already produce, over standard protocols such as BACnet, Modbus and OPC UA. Explore also connects to local-only BMS installations with no cloud licence through an agent on the BMS PC. See our integrations pages for the major vendor systems.
How is this different from an energy audit? An audit is a snapshot by a human expert, typically repeated every few years. Detection is continuous and automatic. The audit finds what was wrong that month; detection catches what goes wrong afterwards and verifies that fixes held. Most buildings benefit from both.
How much energy waste does a typical building have? The US EPA’s Energy Star programme has cited figures up to 30 percent of consumption in commercial buildings. Any specific building varies widely, which is why we don’t lead with a promised percentage. A good detection platform prices each finding individually from your own data, so the savings claim is specific to your building rather than an industry average.
Can this work across a whole portfolio? Yes, and portfolios are where prioritisation matters most, because findings from every building compete for the same team’s attention. One queue across the estate, ranked by impact, is the approach we’ve built. More on our page about BMS analytics for large portfolios.
Start with one building
If you’re evaluating platforms in this category, our guide to choosing sensor intelligence covers the questions that separate real detection from repackaged dashboards.
The faster route is empirical. Connect one building, let the models run for a couple of weeks, and see what surfaces. Buildings almost always have something to say. Talk it through with us.
FrostLogic Explore brings sensor intelligence, scenario simulation, and grounded-inference AI to commercial and industrial buildings. Learn more about Sensor Intelligence or talk it through with us.
Curious how this would look on your building?
What's your building not telling you?
Tell us what you're trying to figure out: energy drift, a BMS you don't trust, compliance you're chasing. We listen first, then tell you straight whether Explore helps. 30 or 60 minutes, your pick. No commitment either way.