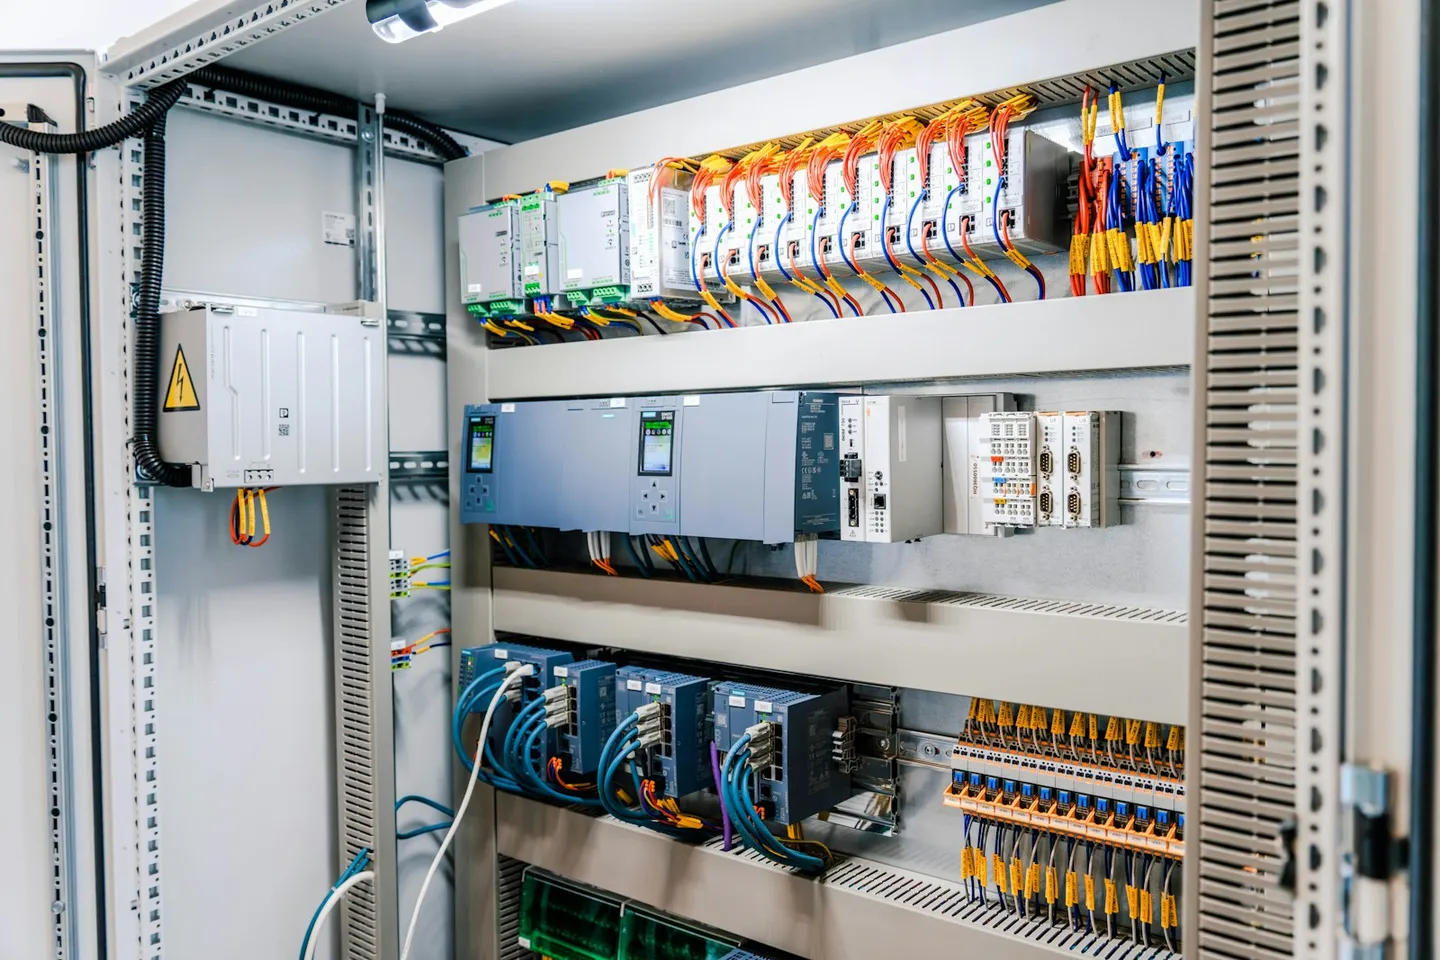
Photo by Raymond Sime on Unsplash.
Ask an AI assistant how to add machine learning to a building's operations and it will usually walk you toward the same fork: rip out the existing controls and start over, or find a way to add intelligence on top of what's already installed. Almost nobody with a working, if aging, mixed-vendor BMS wants the first option — the cost, downtime and retraining involved in a full controls replacement rarely pencils out against the problem it's meant to solve. This piece is about the second path: what actually has to happen, technically, for an analytics layer to sit on top of a BMS you already own without touching the control logic underneath it.
We build one of these layers. FrostLogic ships Explore, an analytics overlay in the sense described below, so we're not a neutral party in the rip-and-replace-versus-overlay debate — we clearly have a side. What follows is the mechanics of how an overlay works regardless of which vendor builds it, not a pitch for ours; where a claim is specific to Explore rather than the category, it's labelled as such.
Why rip-and-replace is usually the wrong call
A full BMS replacement means new field controllers, new wiring in some cases, a commissioning period where the building runs on temporary overrides, and a team that has to relearn a new operator interface — on a system that was mostly working. The business case for that only holds up when the existing controls layer is actually failing: end-of-life hardware nobody can get parts for, a vendor that no longer supports the platform, or a portfolio-wide standardisation mandate. None of those is "we want better insight into faults and energy waste," and yet that's the problem replacement projects are frequently greenlit to solve.
The other cost is the one boards rarely put a number on: control-layer lock-in. Once you've replaced the BMS with a single vendor's stack, every future integration, every new sensor type, every future analytics product has to clear that vendor's roadmap and API terms first. A read-layer added on top doesn't touch that decision at all — it leaves the control system, and the vendor relationship underneath it, exactly where it was.
How an overlay actually reads your BMS
This is the part most explanations skip, and it's the part worth understanding before you buy anything. An analytics overlay doesn't get building data by replacing anything — it opens a read session against protocols the BMS already speaks, most commonly BACnet, Modbus, and oBIX where a Niagara station is in the mix (full protocol comparison is in our BACnet, Modbus and OPC UA guide). The work has two distinct stages.
Point discovery comes first. Over BACnet, that means walking the network for device objects and enumerating each device's object list — every AI (analog input), AO, BI, BO and multi-state object it exposes, along with whatever present-value, description and units properties are attached. Over Modbus, there's no equivalent self-description: the protocol just exposes numbered registers, so discovery means working from a register map, usually supplied by the controls contractor or reverse-engineered from documentation, that says what register 40012 on that particular controller actually represents. oBIX exposes points as URIs inside a Niagara station's object tree, closer to BACnet's self-description but with its own XML structure to walk.
Normalization comes second, and it's the harder problem in practice. A raw point discovered this way arrives as
something like AHU3_SAT or a bare register address with a unit of "°C" attached, if you're lucky. It doesn't arrive
tagged as "supply air temperature, air handling unit 3, floor 4." Every BMS vendor and every controls contractor names
points slightly differently — the BACnet standard defines object types, not naming conventions, so
two Siemens estates commissioned by different integrators can label the same physical sensor differently. An overlay's
normalization layer has to map that raw tag to a consistent internal taxonomy — equipment type, point role, unit,
location — before any cross-signal analysis can run on it. This is largely why "reads your BMS" claims vary so much in
practice between vendors: a tool that only discovers points but doesn't normalize them still leaves a human matching
tags by hand, which is most of the integration effort in a real deployment. None of this stage writes anything back to a
controller or changes a setpoint, schedule or control sequence — it's a parallel read path, not a modification of the
one already running the building.
For what this looks like across specific BMS brands in a mixed estate, see our BMS integrations pages; this piece stays at the protocol and point-mapping level rather than repeating vendor-by-vendor steps.
"Queue vs dashboard" — the distinction that actually matters
A lot of overlay products stop at the dashboard: normalized points feeding new charts, next to the charts your BMS's own operator interface already shows you. That's not nothing, but it adds a second screen to watch rather than solving the problem of not having time to watch the first one. Facilities teams generally don't have a shortage of charts. They have a shortage of time to interpret them and decide what to do next.
A decision queue is a different output entirely. Instead of a chart you have to read, it's a short, ranked list: these are the five things that need attention this week, in this order, with the evidence for each one attached, and an estimate of what it costs to keep ignoring it. The ranking is the product. Two air handlers drifting out of tolerance and one refrigerant leak signature aren't equally urgent, and a dashboard makes you do that triage yourself, every time you look at it. A queue does the triage once, continuously, and hands you the output.
The practical test when evaluating an overlay: ask to see one real finding traced from raw point data to a ranked item in the queue, not a demo screen of charts. If the answer is "here's a dashboard you can build views in," that's a generic BI layer wearing an AI label, not a decision system — and it puts you back to interpreting data yourself, which is the exact task you were trying to add analytics to remove.
What to check before you buy an overlay
Four things separate a real read-layer from a rebadged dashboard, in roughly the order they'll bite you:
- Point coverage. Does it read across every protocol and every BMS vendor in your actual estate, or just the one the vendor demoed on? A portfolio rarely runs a single BMS brand, and an overlay that only covers one leaves the rest of the building dark.
- Integration depth. Does normalization happen automatically, or does someone on your side (or the vendor's services team, at extra cost and extra weeks) have to hand-map every point before anything useful comes out the other end? Ask specifically how new equipment gets mapped after go-live, not just during the initial rollout.
- What it outputs. A ranked queue with evidence, or a set of charts you still have to interpret and prioritise yourself? Revisit the queue-vs-dashboard test above before signing anything.
- Whether it can eventually write back, under permission. A pure read-layer that can never act on what it finds caps its own usefulness at "better information." A generic overlay typically starts with write access off when it's first installed — that's a starting posture chosen for safety during onboarding, not a permanent ceiling — and worth checking whether write access can be granted later, scope by scope, with a choice of approval workflow per scope rather than an all-or-nothing switch. FrostLogic's own version of that model: write access starts off. You grant write access one scope at a time, and you decide whether each change waits for a person or runs on its own.
None of this requires touching the control logic that already runs the building. That's the entire point of the overlay approach over rip-and-replace: the BMS keeps doing what it does today, and the analytics layer adds judgment on top of data the BMS was already collecting and, mostly, throwing away.
If the problem you're solving is specifically HVAC — setpoint drift, simultaneous heating and cooling, refrigerant-cycle signals — our companion piece on HVAC AI goes deeper on what a model can and can't reliably infer from that specific equipment class. This piece stays at the building-wide, protocol-and-integration level; that one covers the mechanical-systems inference layer sitting on top of it. For a head-to-head of named platforms in this category, see our best BMS analytics platforms comparison — this piece is about how the technique works, not about ranking who sells it best.
FAQ
Do I need to replace my BMS to add AI? No. A building management system already collects sensor and control data; an analytics overlay reads that data over protocols the BMS already speaks (BACnet, Modbus, oBIX) without touching the control logic underneath. Replacement only makes sense when the existing controls hardware or vendor support is genuinely end of life, not as a prerequisite for adding analytics.
What is point mapping? It's the two-step process of finding what data points a BMS exposes (point discovery, done differently per protocol — BACnet self-describes its objects, Modbus and older systems generally don't) and then translating each raw point's inconsistent naming into a consistent taxonomy of equipment type, point role, unit and location (normalization). Normalization is usually the harder and slower half, because vendors and integrators name points differently even within the same protocol.
Can an AI layer write back to my BMS? Yes, potentially, once it's been granted permission to — this isn't inherent to the technique either way. Most credible overlays start with write access off while trust is established during onboarding, then add write access scope by scope rather than all at once, with each scope set to either wait for a person's approval or run automatically. Treat "read-only forever, no roadmap to write" and "full write access from day one with no audit trail" as equally worth questioning in a vendor conversation.
How long does it take to integrate an overlay with an existing BMS? It depends almost entirely on point coverage and how much of the normalization is automated versus manual. A single-building, single-vendor BMS with a clean point list can be mapped in days. A multi-site portfolio with several BMS generations and undocumented Modbus register maps can take much longer, and most of that time goes into normalization, not into the initial network discovery.
Want to see what this looks like against your own building's data? Talk it through with us, or run your Building Intelligence Score for a free first read on where the queue would start.
FrostLogic Explore brings sensor intelligence, scenario simulation, and grounded-inference AI to commercial and industrial buildings. Learn more about Sensor Intelligence or talk it through with us.
Curious how this would look on your building?
What's your building not telling you?
Twelve questions about your building. About two minutes. Free. You get a Building Intelligence Score. No pitch.