Predictive maintenance in manufacturing: process telemetry to ranked actions
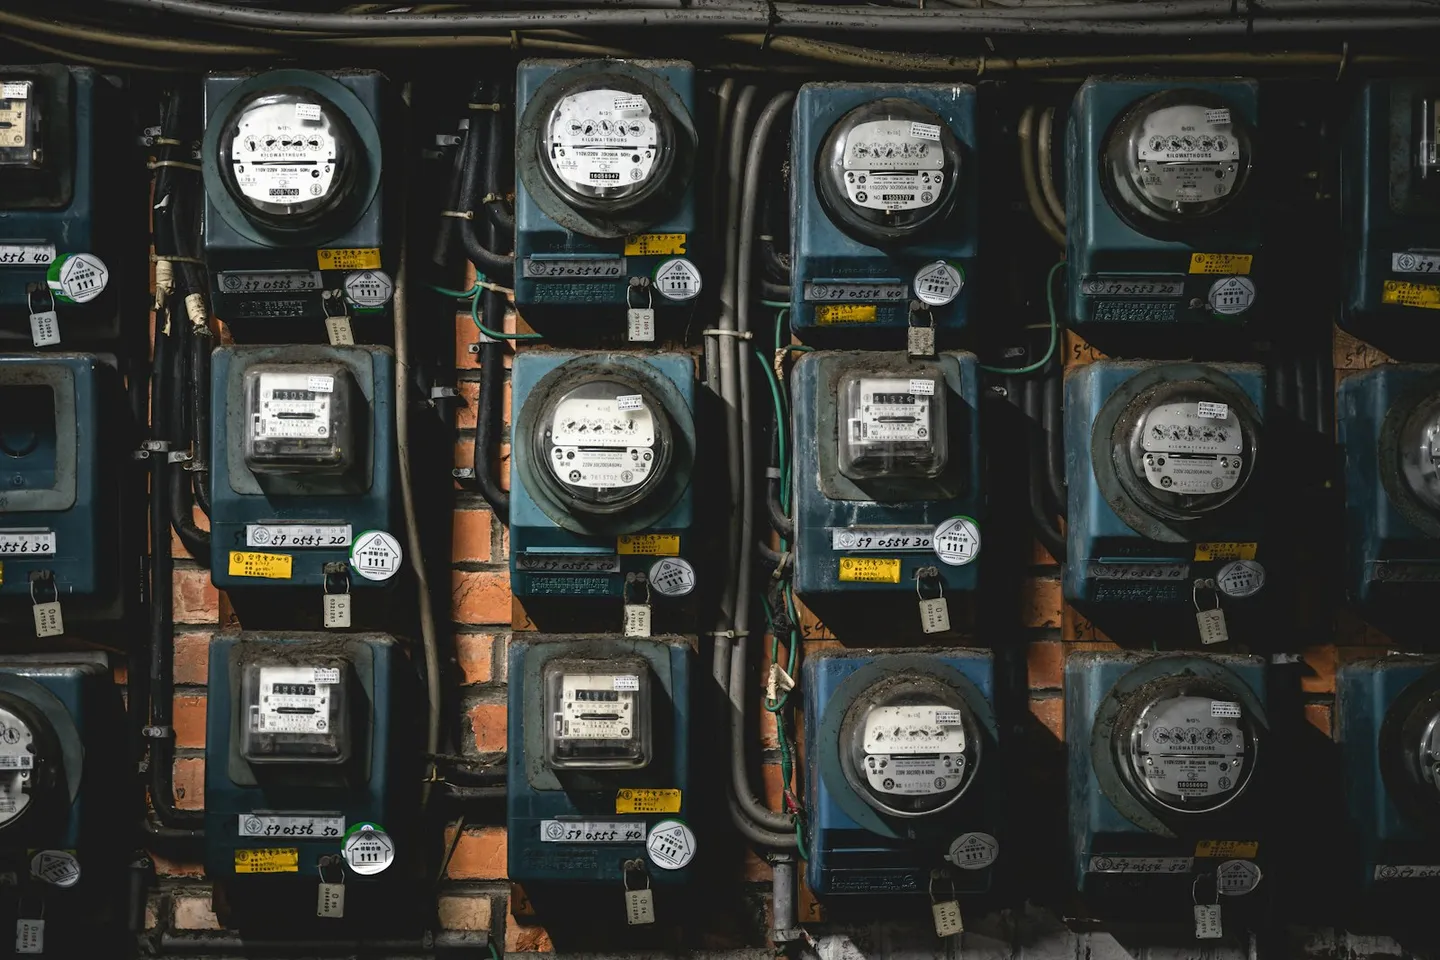
Photo by Ant Rozetsky on Unsplash.
Every plant already runs the sensors a predictive maintenance program needs. PLCs, SCADA historians, vibration probes, thermal sensors, and OPC UA servers generate more telemetry per shift than any reliability team can read manually. Most of that data sits in the historian and never becomes a decision.
Sensor coverage is rarely the problem. The missing piece sits between raw tags and a ranked list of what to fix this week: reading process telemetry analytics that already exist and turning them into actions a maintenance team can act on before the line goes down.
Where downtime actually comes from
Unplanned downtime rarely announces itself. A bearing degrades over weeks before it seizes. A motor's current draw creeps upward for a month before the trip. By the time an operator notices something is wrong, the failure mode has usually been visible in the data for a while.
The direct cost of the eventual repair is often the smaller number. Lost production, expedited parts, overtime labor, and missed shipment windows compound around it. Industry estimates commonly cited put the reduction from a working predictive maintenance program in the 30-50% range for unplanned downtime, though the number depends heavily on baseline maintenance maturity and should be read as a directional estimate, not a guarantee for any specific plant.
Most machine maintenance programs already have the sensors to catch these failures earlier. What's missing is a way to watch every signal continuously without generating an alarm for every one of them.
From PLC, SCADA, and OPC UA to a decision layer
Reliability teams already have the telemetry: PLC tags, SCADA points, and increasingly a standard OPC UA server exposing them all in one place. Adding a decision layer on top of that data doesn't mean touching the control loop.
FrostLogic Explore reads process telemetry with write access starting off, over OPC UA, Modbus, or PLC-vendor APIs. Write access to a setpoint stays off until you grant Explore a scope, and outside that scope it never sits in the control path. The engine behind this factory equipment monitoring, Frostdynamics(tm), ingests the same tags the SCADA historian already stores, and correlates them across the physics that actually govern the equipment, not just per-tag thresholds.
That distinction matters on a factory floor more than almost anywhere else. A pump's vibration, its motor current, its bearing temperature, and its flow rate are not independent variables. A threshold on any single one of them will either fire too often or miss the failure that shows up as a small shift across all four at once. Reading the tags together, the way an experienced reliability engineer already does mentally, is what separates a decision layer from another dashboard.
Anomalies that matter on a line
Not every deviation is worth a ticket. Industrial anomaly detection that's actually useful on a line looks for a specific shape: deviations that build over time and touch more than one signal.
Vibration drift is the clearest example. A bearing's vibration signature doesn't jump; it climbs, often over weeks, well before it crosses a fixed alarm threshold. Thermal creep on a motor or gearbox behaves the same way: a slow rise that a shift-based visual inspection will miss entirely.
Cross-signal incoherence catches failures a single-channel threshold structurally cannot. When flow, pressure, and power draw stop moving together the way the process physics says they should, something upstream has changed, even if no individual tag has crossed its limit. Energy-per-unit drift is the same pattern applied to cost: a line consuming more power per unit of output than its own historical baseline, without a corresponding output change, is degrading somewhere even if nothing has alarmed yet.
Each of these is detectable with the sensors already installed. What they require is watching the relationship between signals continuously, not scanning a single tag against a fixed limit once a shift.
Causal filtering on the factory floor
A cross-signal anomaly upstream tends to trip a dozen tags downstream. Flow drops, pressure spikes on the next stage, a temperature alarm fires on the stage after that, and a reliability engineer opens a shift log full of alerts that are really one event.
Causal filtering traces that chain back to the root cause and collapses it into a single ticket: the pump bearing, not the eleven symptoms of it failing. That's the difference between a ranked, explained cause and an alarm storm the team learns to ignore.
To be explicit: Explore ranks and explains the cause. It does not issue or track work orders, and it isn't a CMMS.
The output is a prioritized, causally traced ticket that tells a reliability engineer what's actually wrong and how confident the system is. What happens next, whether the ticket lands in an existing CMMS, a paper log, or a Slack channel, is the plant's process. Explore's job ends at the diagnosis, delivered early and already filtered.
Same engine, different signal
The physics-aware approach that catches a bearing failure on a production line is the same engine that catches an HVAC drift in a commercial building. Both are cases of watching multiple correlated signals for a pattern that a single-tag threshold would miss, and both need to suppress the downstream noise a real root cause generates.
What changes between a plant floor and a building is the signal set, not the underlying logic. A building's air handler produces a different telemetry shape than a stamping line's servo motor, but the question the platform is answering, which of these deviations is a real precursor to failure and what's actually causing it, is identical. Our companion piece on predictive maintenance in commercial buildings covers the same engine applied to HVAC, chillers, and building equipment.
For manufacturing and heavy-industry operators specifically, that means a plant doesn't need a bespoke analytics build to get this. The same platform that reads a building's BMS reads a plant's OPC UA server, and ranks the output the same way: by how much it threatens uptime, not by how loud the alarm is. More on how this fits a manufacturing site specifically is on our manufacturing industry page.
FAQ
What is predictive maintenance in manufacturing? It's using sensor and process data, vibration, temperature, current draw, flow, and similar signals, to detect equipment degradation before it causes an unplanned stop, rather than replacing parts on a fixed schedule or waiting for a failure.
How much downtime does predictive maintenance actually reduce? Estimates vary by plant and baseline maturity, but a reduction in the 30-50% range for unplanned downtime is commonly cited across industry studies. Treat it as a directional estimate rather than a number to plan a business case around without your own baseline data.
Does adding a predictive maintenance layer require new sensors? Usually not. Most plants already have the PLC tags, SCADA points, and OPC UA tags needed. The gap is typically in correlating existing signals continuously, not in sensor coverage.
What is OPC UA and why does it matter here? OPC UA is a vendor-neutral industrial communication standard that exposes process data from PLCs and SCADA systems in a consistent way. It's what lets a decision layer like Explore read telemetry from mixed-vendor equipment without a custom integration per machine. See our glossary entry for the protocol-level detail.
Is this the same as a CMMS? No. A CMMS manages work orders and maintenance schedules. Explore ranks and explains anomalies in your process data. It doesn't issue or track work orders. The two are complementary, not competing categories.
Does Explore control any equipment or write to the PLC? Only where you let it. Explore reads process telemetry with write access starting off, over OPC UA, Modbus, or a PLC vendor's API. You grant write access to specific points one scope at a time, and outside that scope nothing moves.
What kinds of failures get caught earliest? Failure modes that build gradually across correlated signals, bearing wear, thermal creep on motors and gearboxes, and cross-signal incoherence, tend to show up in the data weeks before a fixed threshold would trip. Sudden mechanical failures with no gradual signature are harder to predict from telemetry alone.
How is this different from a standard vibration-monitoring program? Vibration monitoring alone watches one signal class. Explore correlates vibration alongside current draw, temperature, flow, and other process tags, which catches failure modes a vibration-only program misses and suppresses the downstream alarm storm a single root cause otherwise generates.
Ready to see it on your own data?
See it on a sample of your process data. Talk it through with us. Bring an export of your OPC UA or SCADA tags and we'll walk through what a ranked, causally traced queue looks like against your actual equipment. 30 or 60 minutes, your pick. No commitment either way. Talk it through.
FrostLogic Explore brings sensor intelligence, scenario simulation, and grounded-inference AI to commercial and industrial buildings. Learn more about Sensor Intelligence or talk it through with us.
Curious how this would look on your building?
What's your building not telling you?
Twelve questions about your building. About two minutes. Free. You get a Building Intelligence Score. No pitch.