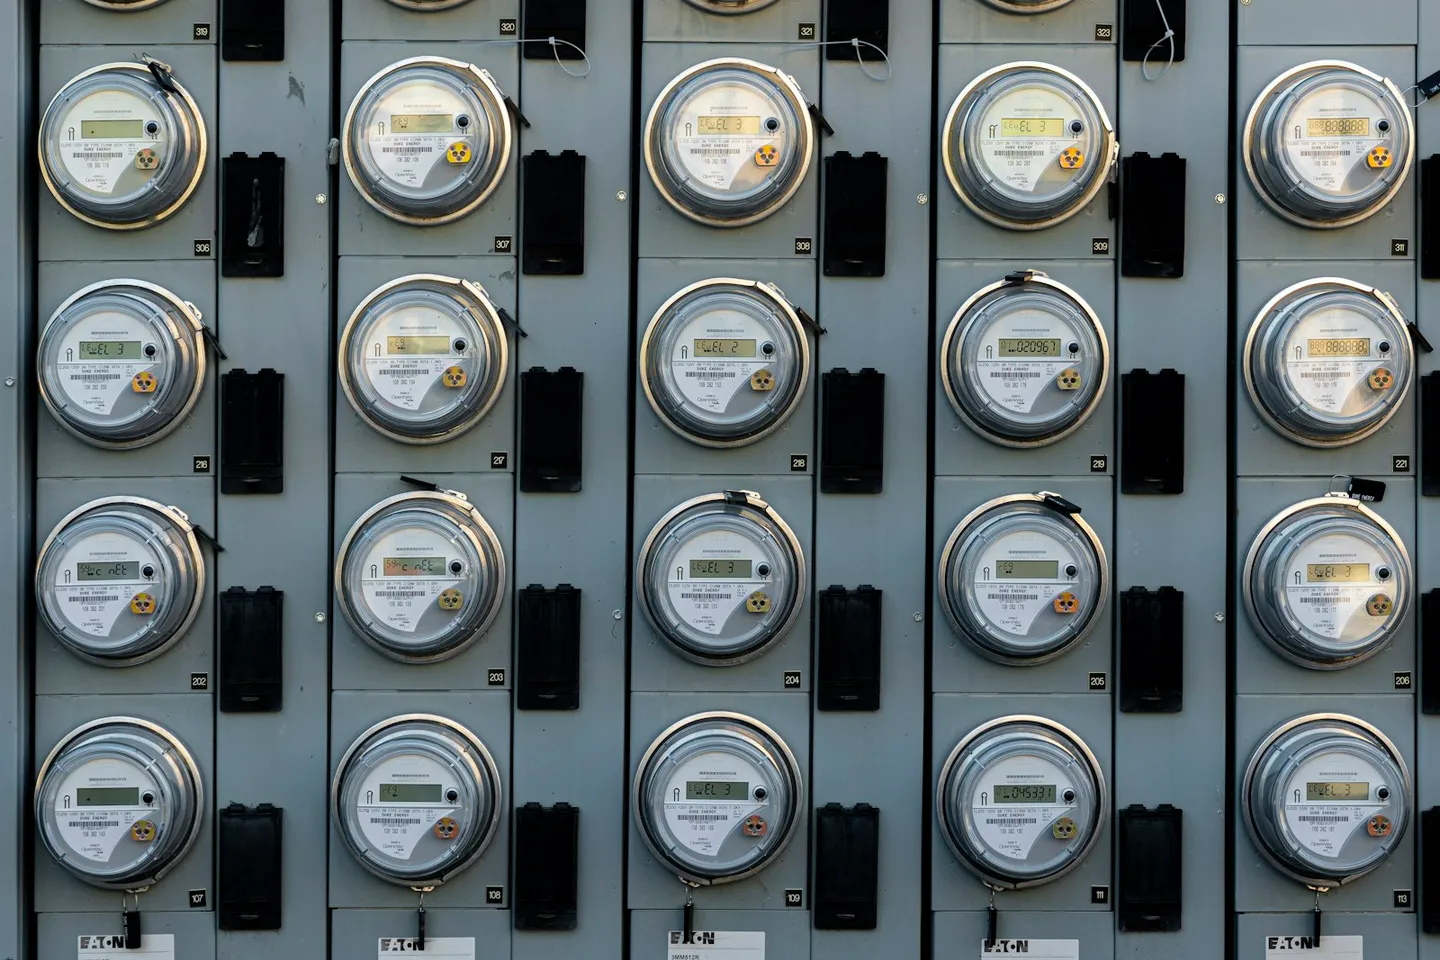
Photo: Commercial electrical meter on a building wall. Photo by Jon Moore on Unsplash.
Energy monitoring and targeting is the UK name for a simple discipline: measure how a commercial building uses energy, set a realistic target for that use, and act when the meter disagrees. Operators who treat it as a one-off audit miss the point. M&T is continuous. The meter keeps talking; the question is whether anyone has a method for listening and a habit of responding.
That is different from staring at dashboards. A dashboard shows you what happened. Targeting asks whether what happened was acceptable, and exception action is the part that turns the answer into a lower bill. Get the sequence wrong and you buy plant, software and consultancy before you know which kilowatt-hours were avoidable. Get it right and capital decisions wait until the waste has a name, a size and a cause.
What energy monitoring and targeting actually is
In UK energy-management practice, energy monitoring and targeting grew out of industrial and commercial programmes that the Carbon Trust and predecessor bodies promoted for decades: continuous measurement, weather-aware baselines, and a closed loop that treats overspend as something to investigate, not something to explain away at year-end. The vocabulary is older than most of the platforms now sold against it. That is useful. It means the method does not depend on a particular vendor screen.
Three layers sit inside the phrase.
Monitoring is the measurement and collection side: main meters, submeters, half-hourly (or finer) interval data, BMS points that carry useful load or status, and enough context that a reading means something. Commercial energy monitoring at building scale fails when the only feed is a monthly bill total. It also fails when every circuit is metered but nobody collects, stores or reviews the readings. Explore's energy monitoring layer is the product-side home for that continuous read on FrostLogic estates; this article is about the discipline those reads support.
Targeting is the comparison against expected use. The target is not a motivational slogan. It is a model of what the building should consume given weather, occupancy, operating hours and known process loads. When actual use drifts above that model for long enough, you have an exception. When it drifts below, you have a success to lock in or a model that needs tightening.
Automatic M&T (aM&T) is the same loop with less spreadsheet labour: interval data lands automatically, baselines update, and exceptions surface without someone pasting CSV into charts every Monday. aM&T does not invent a new theory of buildings. It removes the friction that made classic M&T die in the inbox.
None of that is the same job as buying an energy management system brand, and it is not the same page as energy management systems for commercial buildings. EMS and BEMS products package metering, analysis and routines. M&T is the operating method those products are supposed to run. If the product only charts, you still do not have targeting. If it targets but nobody acts on the exceptions, you have a reporting hobby.
One-off audits still matter. They find capital opportunities a continuous loop will not invent on its own. They do not replace energy monitoring and targeting between audits. Drift, schedule errors and fighting plant show up week to week, not once every four years.
CUSUM and degree-day regression: two techniques that still work
Two techniques from the classic toolkit still earn their keep on commercial estates, even when the software around them has changed.
CUSUM (cumulative sum) tracks the running total of deviations from expected use. Each period you compare actual consumption against the target for that period. The difference, positive or negative, is added to a cumulative total. A one-off spike may be noise. A sustained step-change shows up as a CUSUM line that walks away from zero and does not come back. That is why CUSUM was popular in factories and large buildings long before anyone said "anomaly detection": it is good at spotting a new normal, not just a loud outlier.
Degree-day regression (and weather-normalised models more broadly) separates weather-driven load from everything else. Heating degree days and cooling degree days give you a simple weather signal. Plot consumption against those degree days over a baseline period, fit a line (or a slightly richer model), and you get an expected use for any given weather week. When this week's meter sits above the weather-expected band, you have a candidate exception that is not "it was cold." When it sits below, you may have locked in a real improvement.
Together they answer the two questions operators actually ask: has the building's relationship with weather changed, and has something shifted that is not weather? Energy use intensity still helps as a benchmark companion for annual and peer comparison, but EUI alone will not catch a mid-season control fault. Portfolio energy benchmarking scores the building against peers once a year. M&T watches the same meters every week.
Model-based anomaly detection is the natural hand-off from that toolkit. Instead of one CUSUM chart per meter and a human eye on every line, a modern layer runs multiple detection methods against the same feeds, reconciles what they find, and prices the waste. That is the path from classic M&T charts to continuous energy waste detection: same intent (find avoidable use), denser evidence, less reliance on someone remembering to open the right spreadsheet.
You do not throw CUSUM and degree-day regression away when you add models. You stop treating them as the whole system. They remain good explanations for why a finding is real, and good checks when a model output looks odd.
CIBSE TM39: what to meter, at what interval
CIBSE TM39: Building metering and monitoring (2026) is the current Chartered Institution of Building Services Engineers guidance on metering strategy for buildings. The 2009 edition is archived; if a consultant still cites TM39 (2009) as live guidance, ask for the 2026 text. The core claim has not gone soft with the new edition: meters alone save no energy. Readings have to be collected, analysed and acted on. A submeter that nobody trends is decorative copper.
TM39's practical value for commercial energy monitoring is the discipline it brings to three decisions.
What to meter. Main incoming supplies are necessary and never sufficient. Submetering should follow the loads that dominate the bill and the decisions you can actually take: HVAC plant, lighting distributions, tenant or floor zones, major process or IT loads, and anything you intend to manage under a green lease or internal recharge. Metering everything at once is expensive and often unread. Metering only the landlord supply leaves tenant-driven waste invisible and landlord-driven waste hard to separate.
At what interval. Half-hourly (or comparable interval) data is the working minimum for most analytical M&T on electricity. Daily or monthly totals can support high-level targets; they hide the overnight load, the Monday morning spike and the weekend setback failure. Gas and heat may sit on different practical intervals depending on the meter, but the principle is the same: the interval has to be fine enough that an exception is actionable while it is still small. How business smart meters and half-hourly data land in the UK market, including AMR, SMETS2 and MHHS, is covered separately; TM39 is the metering-strategy frame those feeds should sit inside.
How data reaches analysis. Interval registers are useless if they die in a supplier portal. A working M&T setup lands meter data alongside BMS and sensor feeds in one place, with enough retention to build baselines and enough context (weather, schedules, tariffs) to interpret them. That is the job of a data warehouse for building telemetry, not of another PDF export once a month. BMS and M&T integration at a working level means: the meters that matter are polled or pushed on a schedule, the histories are queryable, and the same clock and site identity apply across sources so a Tuesday spike on the main meter can be lined up with a fan status or a chilled-water valve.
Real-time energy monitoring, where "real-time" means near-live interval updates rather than a yearly spreadsheet, is what makes exception action possible in the same week the waste appears. TM39 does not require every building to run a trading-floor style live wall. It does require that metering strategy and data collection match the analysis you claim to run.
From M&T numbers to a ranked queue
Classic energy monitoring and targeting ends when the exception is identified, sized and assigned. Someone still has to decide which of twenty exceptions gets the engineer this week. Spreadsheets do not rank well across a portfolio. Neither do twenty separate CUSUM charts.
FrostLogic Explore sits on the measure-before-you-decide layer that M&T describes. It reads BMS points, energy meters and IoT sensors, runs detection and forecasting with confidence bounds through FrostDynamics, and returns a prioritised queue of decisions rather than another dashboard. The dashboard is the question. The queue is the answer. Evidence stays attached to each item so an operator can see why it ranked where it did.
That hand-off matters for estates that already do competent M&T in Excel or a legacy aM&T package. Keep the meters. Keep the half-hourly feeds. Keep the habit of acting on exceptions. What changes is the cost of maintaining the loop across many sites and many data sources, and the ability to price findings against each other so the team works the expensive waste first.
Automation is optional and scoped. Explore can propose write-back through the FrostLogic Edge Agent after human review, or run automatically inside permissioned scopes you grant. Write-back starts off. Nothing moves a setpoint until that scope exists. Explore is not a CMMS; work orders and dispatch stay in whatever maintenance system you already run.
If you are still arguing about which capital project to fund, finish the M&T loop first. Energy monitoring and targeting for commercial buildings is how you find the waste before you buy anything. The software layer is how you keep finding it after the spreadsheet stops scaling.
FAQ
What is energy monitoring and targeting? Energy monitoring and targeting (M&T) is the continuous practice of measuring a building's energy use, comparing it to a weather- and occupancy-aware target, and acting on exceptions when actual use drifts. Monitoring is the measurement and collection. Targeting is the comparison against expected use. Exception action is what turns the comparison into lower consumption.
How does M&T differ from an EMS or BEMS? An energy management system (EMS), or building energy management system (BEMS) in UK usage, is the metering, software and routine package used to manage energy. M&T is the operating method that package is supposed to run: measure, target, act. You can buy EMS software and still lack targeting if the product only charts. You can run competent M&T on simpler tools if the loop is real.
Does CIBSE TM39 require half-hourly metering everywhere? TM39 is guidance on metering and monitoring strategy, not a statutory half-hourly mandate for every circuit. In practice, half-hourly or comparable interval data is the working minimum for useful analytical M&T on electricity, because coarser totals hide the patterns that make exceptions actionable. The 2026 edition still stresses that meters save nothing unless readings are collected, analysed and acted on.
How does CUSUM relate to AI anomaly detection? CUSUM accumulates deviations from expected use so a sustained shift stands out from one-off noise. Model-based anomaly detection extends that idea: more signals, more methods, automatic ranking and costing. CUSUM remains a clear way to explain a step-change. Anomaly detection is how you scale the hunt beyond a handful of hand-built charts.
Do I need new meters to start M&T? Not always. Many commercial buildings already have main meters with half-hourly capability and some submetering. Start with the feeds you have, build targets, and act on exceptions. Add submeters where TM39-style strategy says a decision load is still invisible. New meters without a collection and action loop do not create M&T on their own.
Where does software fit in an M&T programme? Software collects interval data, maintains baselines, surfaces exceptions and, in modern layers, ranks them by cost across a portfolio. It does not replace the operating habit of assigning and closing exceptions. If the software only produces charts nobody owns, the M&T programme has already failed.
Is energy monitoring and targeting the same as a home energy monitor? No. Consumer home monitors track a dwelling's plug and circuit use for household insight. Commercial M&T is an operational discipline for non-domestic buildings: submetering strategy, degree-day baselines, CUSUM-style exception tracking, and action through facilities and engineering teams.
Want to see what continuous M&T looks like on one of your buildings? Talk it through with us and we will walk the findings Explore surfaces from the meters and BMS you already have.
Not ready for a call? Get your Building Intelligence Score. Twelve questions, a free score, and a clear view of where the building is leaking value.
FrostLogic Explore brings sensor intelligence, scenario simulation, and grounded-inference AI to commercial and industrial buildings. Learn more about Sensor Intelligence or talk it through with us.
Curious how this would look on your building?
What's your building not telling you?
Tell us what you're trying to figure out: energy drift, a BMS you don't trust, compliance you're chasing. We listen first, then tell you straight whether Explore helps. 30 or 60 minutes, your pick. No commitment either way.